Applications
Applications are modules designed to collect and display data collected from Linux hosts via the agent. An Application will include an agent module and code in Observium to process, store and display the data.
Apache
Description
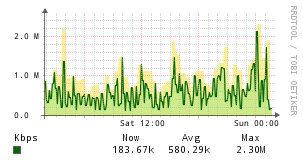
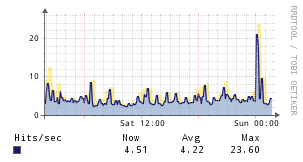
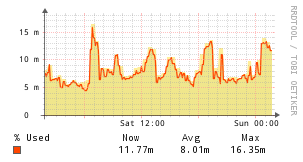
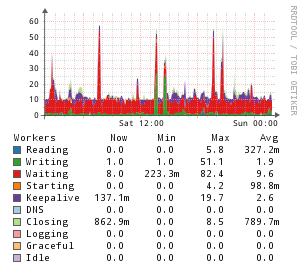
The Apache application monitor uses a Perl script to collect stats from Apache's mod_status output, and hooks into the Unix Agent application structure.
Dependencies
This application poller requires the LWP::Simple perl module (package libwww-perl on Debian/Ubuntu).
Example Graphs
Instructions
First you need mod_status enabled. On Debian/Ubuntu, you can do this by typing
| Text Only | |
|---|---|
1 | |
and restarting apache2. You need to allow connections from localhost so that the agent script can query it for data. It will differ based on your configuration, but something like this :
| Text Only | |
|---|---|
Don't forget the ExtendedStatus line (it's not there on a default Debian installation in /etc/apache2/mods-enabled/status.conf) if you want the first three graphs to work, otherwise you only get the Scoreboard graph.
Copy the apache script from scripts/agent-local in your observium install to the server you wish to monitor, and place it in the unix agent local folder.
The application will then be automatically detected by Observium on the next poll.
Instructions - FreeBSD
Uncomment this line in /usr/local/etc/apache22/httpd.conf
| Text Only | |
|---|---|
1 | |
Add 127.0.0.1 and ::1 (if using IPv6) to the Allow from portion of the Location sections of:
| Text Only | |
|---|---|
1 | |
Add the apache script to the unix agent local scripts directory.
Restart Apache:
| Text Only | |
|---|---|
1 | |
Instructions - cPanel Server
Locate and open the httpd.conf file to verify mod_status is enabled, as well as ExtendedStatus. You should see something similar to this:
| Text Only | |
|---|---|
Open and edit the apache agent script (on the monitored system), and edit line 29 from:
| Text Only | |
|---|---|
1 | |
And change it to match below (whm-server-status instead of server-status):
| Text Only | |
|---|---|
1 | |
dpkg
Description
This agent script populates your device's "Packages" section with the packages installed on your system.
Requirements
The dpkg package manager needs to be installed, so generally that means you're installing this on a Debian or derivative system.?
Instructions
Place the dpkg script into the agent's local directory /usr/lib/observium_agent/local.
Exim
Description
Generates graphs from Exim using the eximstats utility.
Instructions
Place the exim-mailqueue-extended.pl script into the observium agent local directory at /usr/lib/observium_agent/local/exim-mailqueue-extended.pl
Place the exim_stats_process.pl script into the eximstats directory probably at /usr/share/eximstats/exim_stats_process.pl
Edit exim-mailqueue-extended.pl and configure $statsFile to point at your eximstats statistics file.
Edit exi-mailqueue-extended.pl and configure the following settings :
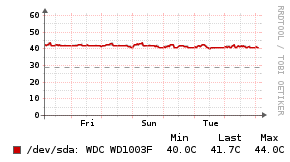
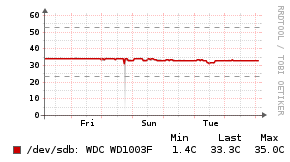
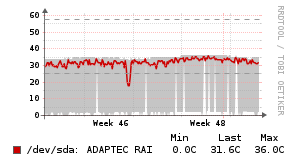
hddtemp
Description
The HDDTemp application monitor uses a bash script to inject statistics into the Unix Agent.
Example Graphs
Requirements
hddtempnetcat(netcat-traditionalon Debian/Ubuntu)
Instructions
Place the hddtemp script into the agent's local directory /usr/lib/observium_agent/local.
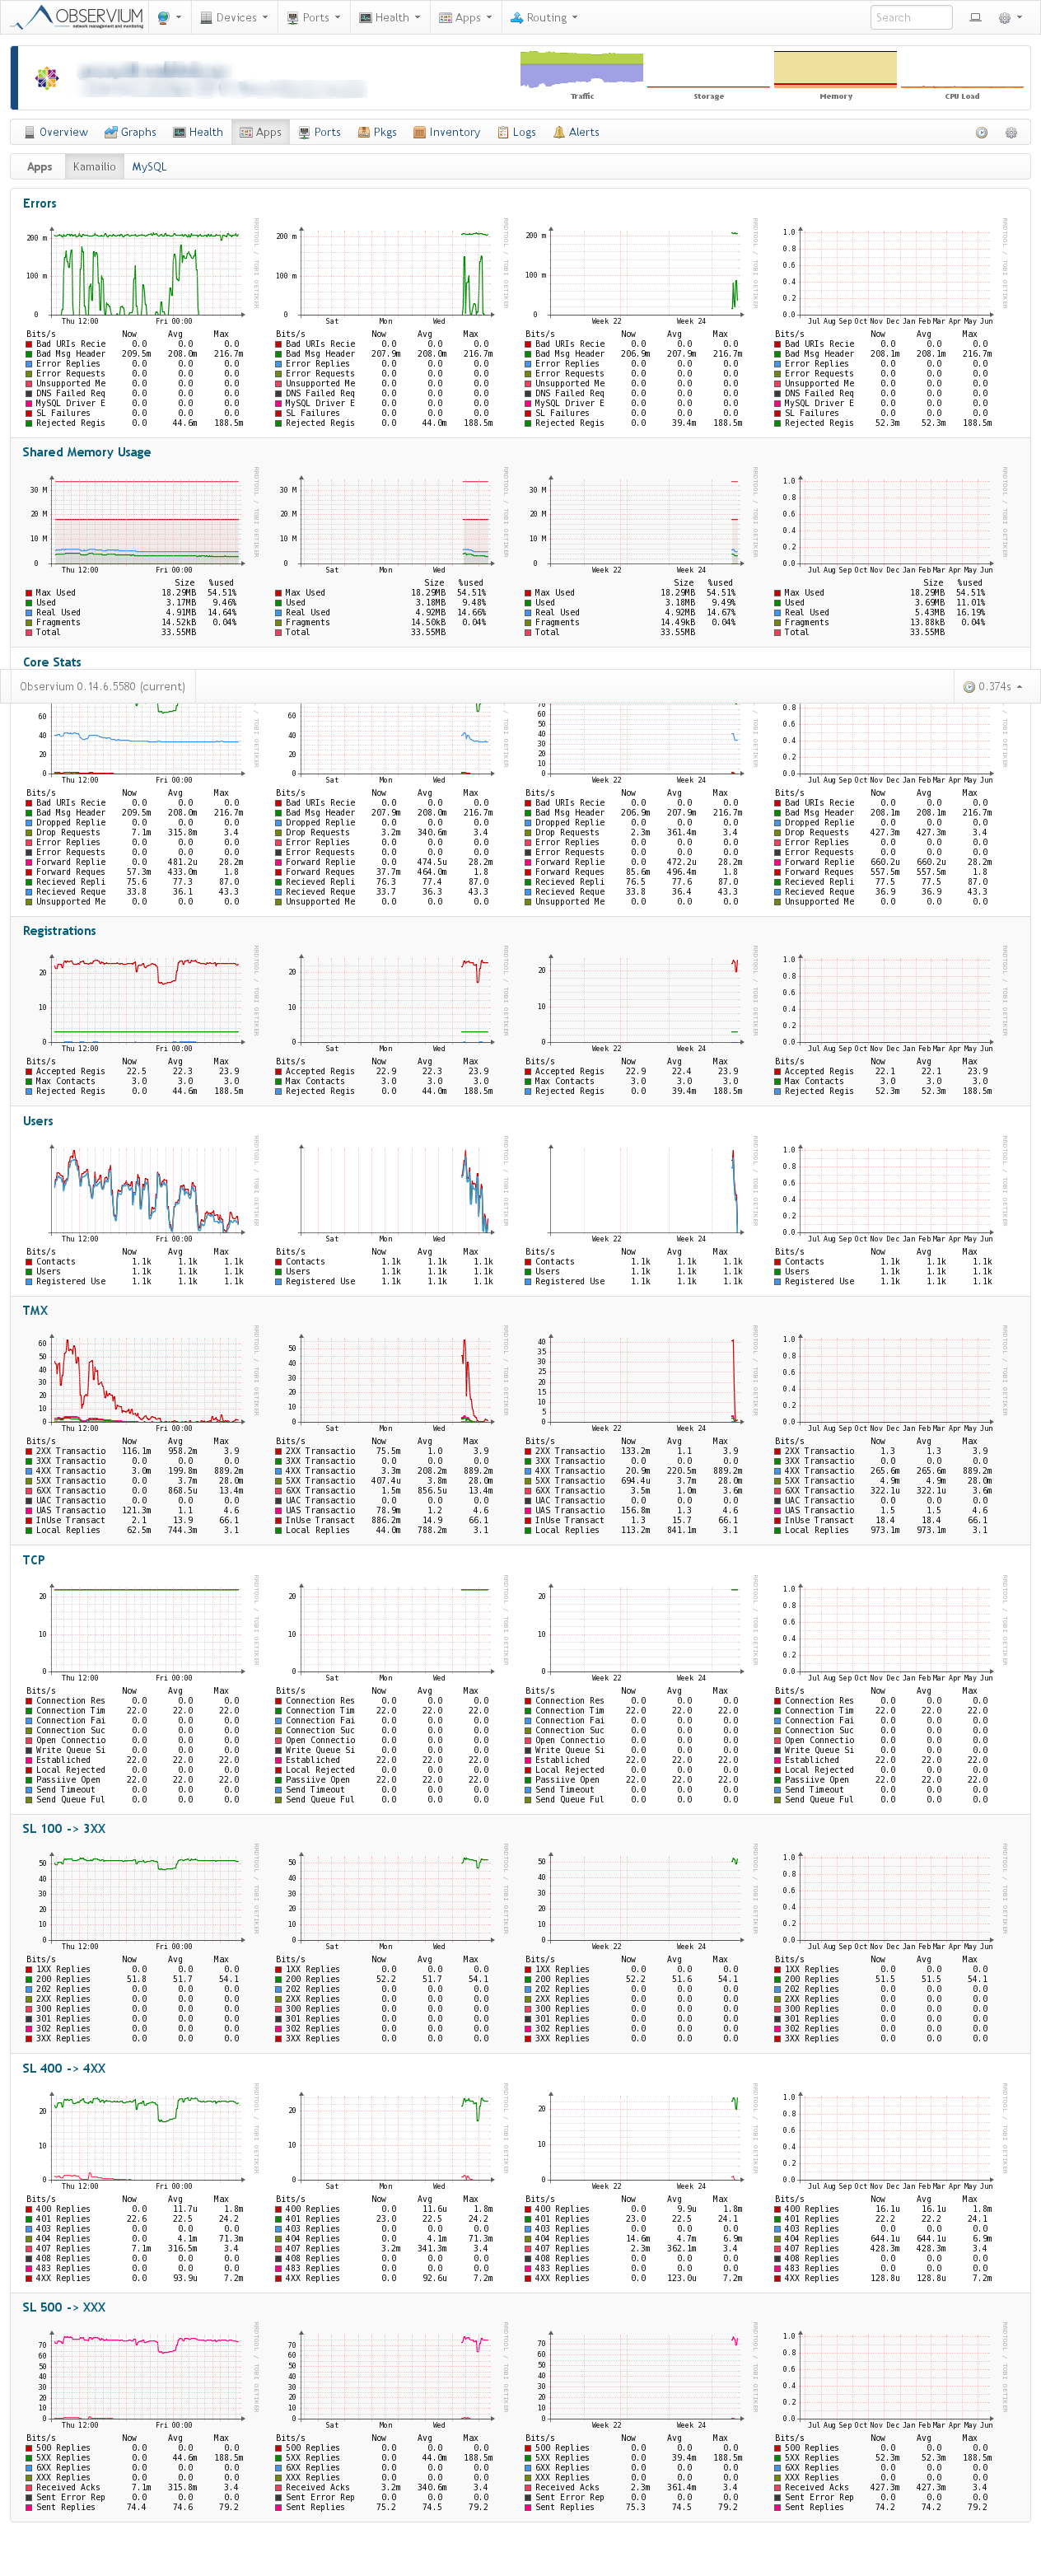
Kamailio
Description
Generates statistics from Kamailio via "kamctl fifo get_statistics all"
Example Graphs
Requirements
mi_fifo.soandkex.somodules loaded in Kamailio
Instructions
Place the kamailio script into the agent's local directory /usr/lib/observium_agent/local.
Lighttpd
Description
Generates statistics for the Lighttpd HTTP server.
Example Graphs
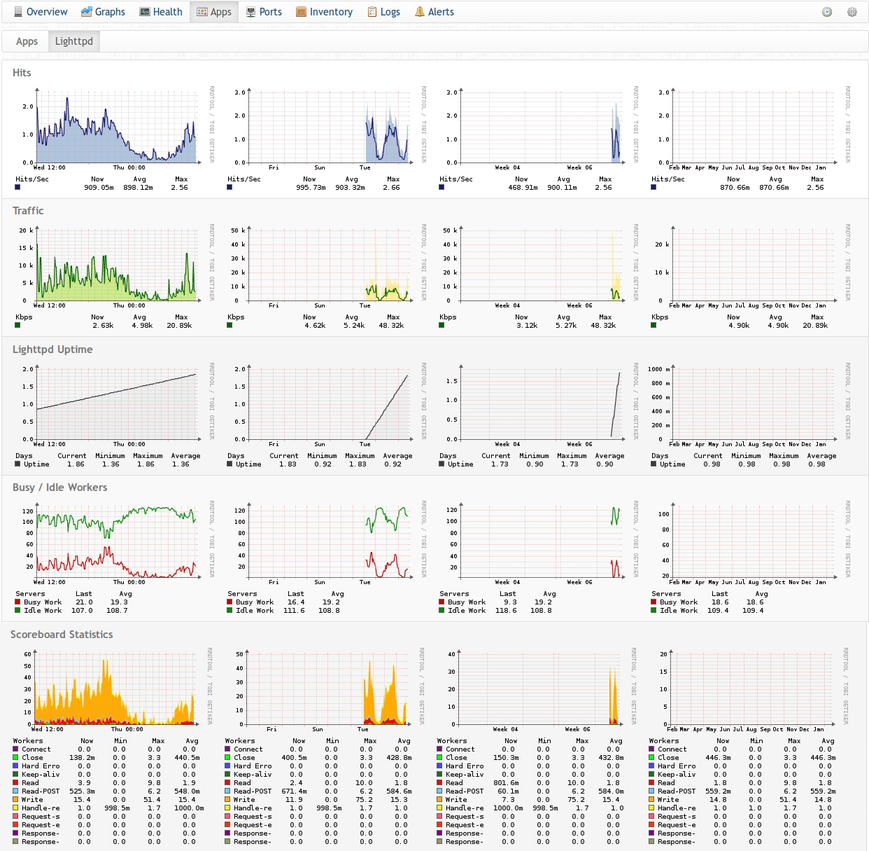
Instructions
This script needs the mod_status module enabled in lighttpd.conf. http://redmine.lighttpd.net/projects/lighttpd/wiki/Docs:ModStatus
## lighttpd.conf server.modules = ( ..., "mod_status", ... ) $HTTP["remoteip"] == "127.0.0.1" { status.status-url = "/server-status"
lm_sensors
Description
This script parses lm_sensors output and adds the resulting sensors to your device in Observium. This is preferred over using the LM-SENSORS-MIB via SNMP, as the SNMP implementation of lm_sensors is rather buggy. Using the agent script will yield far better results.
Requirements
A working lm_sensors configuration is needed (i.e. run sensors-detect and configure lm_sensors) - running sensors should produce useful output.
Instructions
Place the lmsensors script into the agent's local directory /usr/lib/observium_agent/local.
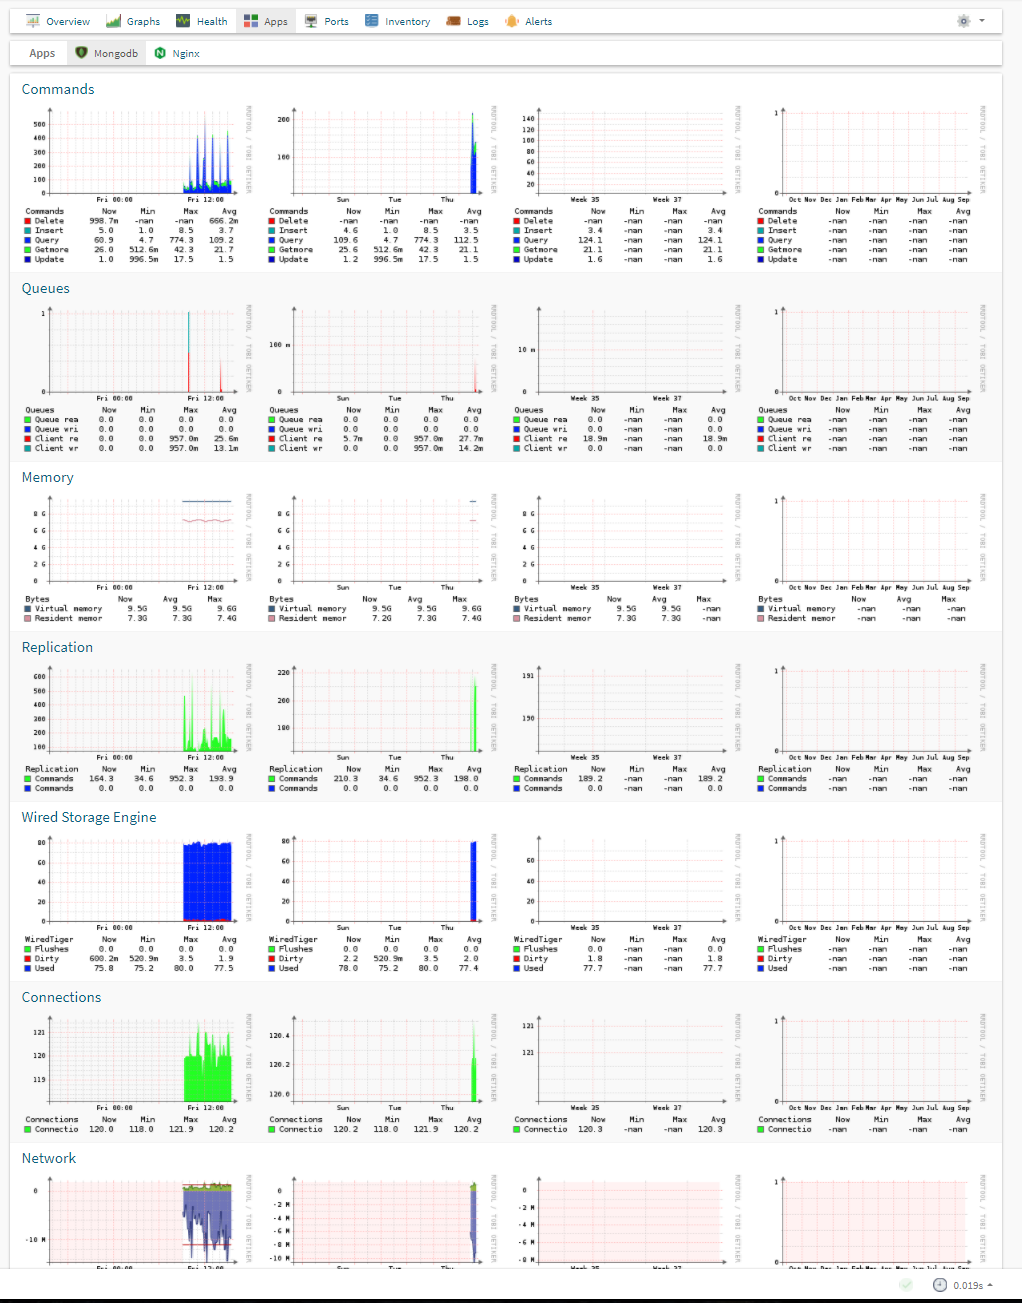
MongoDB
Description
Collects and graphs MongoDB statistics via the mongostat command.
Instructions
Place the mongodb script into the agents local directory /usr/lib/observium_agent/local/.
Example Graphs
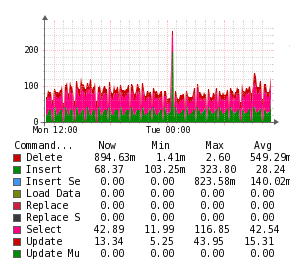
MySQL
Description
The MySQL application monitor uses a PHP script to inject statistics into the Unix Agent.
Example Graphs
Requirements
php-cliphp-mysql
Instructions
First you need to create database user with appropriate privileges:
| Text Only | |
|---|---|
Copy the mysql script from scripts/agent-local/ in your Observium install to /usr/lib/observium_agent/local/ on the server you wish to monitor.
In the same directory on the monitored server, create a configuration file named mysql.cnf containing previously created credentails:
The application should now be automatically detected on the next poller run of Observium. You can check that the script works by running it directly, or by running the Agent and checking for the <<<mysql>>> section.
Note: on Debian based systems, you can just copy in the mysql.cnf file distributed with Observium, without having to create an extra user. The script will then automatically use the Debian system maintenance mysql user.
Nginx
Description
The nginx application monitor uses a Python script to collect stats from the nginx server on the host to be monitored. All stats are hooked into the Unix Agent and no further ports need to be opened.
Example Graphs


Instructions
This module requires the UNIX Agent to be installed on the monitored host.
You need the stub status module for this. You will also need to allow connections from localhost to allow access to the script. It should look something like this:
| Text Only | |
|---|---|
Place the nginx script into the agent's local directory /usr/lib/observium_agent/local.
You can check to make sure the statistics are being generated by running the agent manually.
You should now see the nginx application on your host on Observium after the next polling cycle.
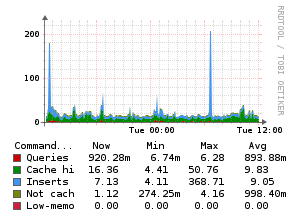
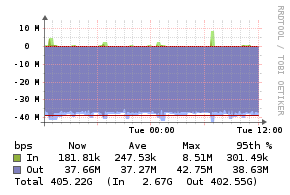
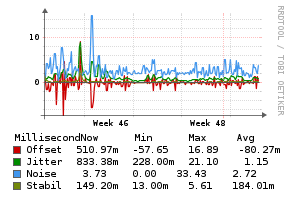
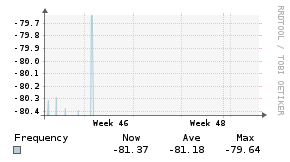
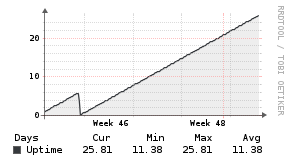
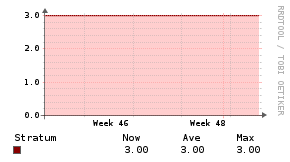
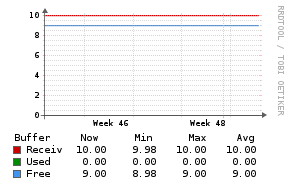
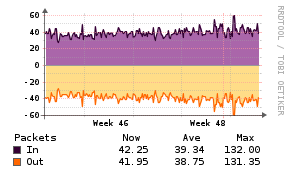
NTPd
Description
The NTPd application monitor uses a PHP script to inject statistics into the Unix Agent.
Example Graphs
Requirements
php-clintpdntpqntpdc
Instructions
Place the ntpd script into the agent's local directory /usr/lib/observium_agent/local.
NVidia SMI
Description
This script allows you to monitor the temperature of NVidia graphics/processing cards installed in your system.
Example Graphs
Placeholder - to be updated soon.
Requirements
The nvidia-smi package is required for this agent script. Make sure it works with your current nvidia driver by running nvidia-smi from the command line.
Instructions
Place the nvidia-smi script into the agent's local directory /usr/lib/observium_agent/local.
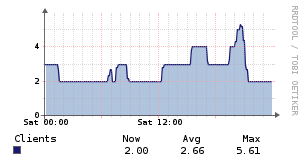
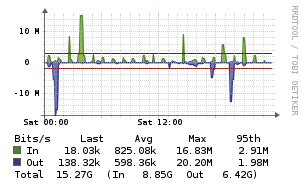
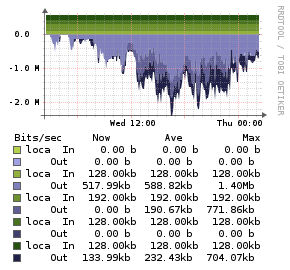
OpenVPN
Description
This agent script graphs the number of connected clients and their (global) network traffic per OpenVPN instance on your VPN server.
Example Graphs
Requirements
A running OpenVPN server is required, with an open management port. The script tries to find the management port and password from your configuration file - the "management" instruction needs to be at the beginning of a line (no '--' in front) followed by the IP address (i.e. 127.0.0.1), a port (i.e. 5000), and optionally by a filename pointing to your management password.
Configuration files matching /etc/openvpn/*.conf are being parsed by the script. When multiple VPN daemons are found, multiple OpenVPN instances will be created for your device in Observium.
If you want to override the OpenVPN configuration directory or the timeout of 2 seconds to connect to the management port, you can create openvpn.cfg in the script's directory and redefine the OPENVPN_DIR and OPENVPN_TIMEOUT variables without editing the actual openvpn script.
Instructions
Place the openvpn script into the agent's local directory /usr/lib/observium_agent/local.
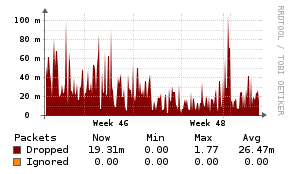
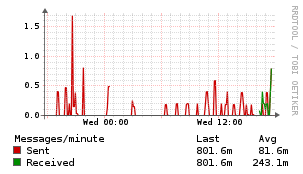
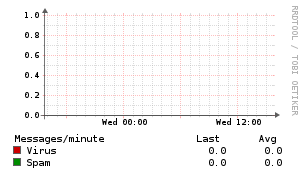
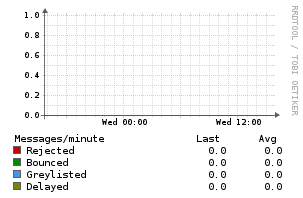
Postfix Mailgraph
Description
The Mailgraph application monitor uses a bash script to inject statistics into the Unix Agent.
Example Graphs
Requirements
rrdtoolmailgraph
Instructions
Install the script in the correct location. Open it up in your favourite editor and make sure the path defined in the RRDPATH variable is correct. The default path is correct for Debian-based distributions when using the mailgraph package.
The values are read from the rrd files the mailgraph daemon writes, so no extra software is needed. Beware that installing mailgraph may pull in a web server; we do not need this, if you don't either, be sure to remove it.
You must change the RRD format used by mailgraph to match the polling frequency of observium, since it's storing a gauge value. Edit /usr/bin/mailgraph and find the line defining $rrdstep and change it to match the poller frequency of 300 seconds:
my $rrdstep = 300;
After making this change you'll need to delete the existing rrds in /var/lib/mailgraph/ and restart mailgraph with /etc/init.d/mailgraph restart.
The application should now be automatically detected on the next poller run of Observium. You can check that the script works by running it directly, or by running the Agent and checking for the <<<postfix_mailgraph>>> section.
PostgreSQL
Description
The Postgresql application monitor uses a Perl script to collect stats from Postgresql Server, and hooks into the Unix Agent application structure.
Requirements
perl- perl DBI module (
libdbd-pg-perlin debian)
Works with
The script supports only postgresql version:
- 9.0 and above.
Instructions
In order to get working postgresql stats in Observium, you need to install the Unix Agent system and setup your poller.
After this is done, you can go to your /usr/lib/observium_agent/local/postgresql.conf file and edit it with the correct dbhost, dbuser and dbpass.
To test if the script is working correctly, you can execute it. The output should be like:
| Text Only | |
|---|---|
1 | |
Debug
If there is no output, than something went wrong and you have to fix your installation. To find out what went wrong, you can enable debug by editing postgresql.pl and putting a value greater than 0 to $DEBUG
with my $DEBUG=1
Than execute the script again to see what went wrong.
PowerDNS Authorative Server
Description
The PowerDNS application monitor uses the PowerDNS control tool to obtain statistics about the authoritative DNS server.
Requirements
pdns_controlbinary in$PATH
Instructions
Place the powerdns script into the agent's local directory /usr/lib/observium_agent/local.
PowerDNS Recursive Server
Description
The PowerDNS Recursor application monitor uses the PowerDNS Recursor control tool to obtain statistics about the recursive DNS server.
Requirements
rec_controlbinary in$PATH
Instructions
Place the powerdns-recursor script into the agent's local directory /usr/lib/observium_agent/local.
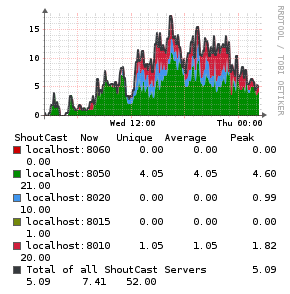
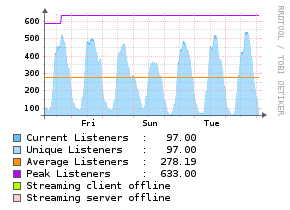
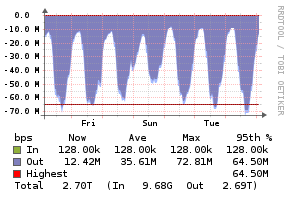
Shoutcast
Description
The Shoutcast application monitor uses a PHP script to read the data from the shoutcast server and injects the statistics into the [[Unix Agent).
Example Graphs
Requirements
php-clicrond
Works with
The script supports only shoutcast version: * 1.x
Instructions
First you need to edit the shoutcast agent script and change the settings:
| Text Only | |
|---|---|
Then you need to edit your shoutcast.conf file:
And for the last part you need to setup a crontab that calls the shoutcast agent script every 5 minutes:
| Text Only | |
|---|---|
1 | |
Unbound
Description
The Unbound application monitor uses the Unbound control tool to obtain statistics about the recursive DNS server.
Requirements
unbound-controlbinary in$PATH
Instructions
Configure the following in your Unbound configuration file:
Place the unbound script into the agent's local directory /usr/lib/observium_agent/local.