Custom OIDs
Observium includes the ability to poll and graph arbitrary custom OIDs. This is useful to add quick support for metrics and devices which aren't yet fully supported by Observium. This is often easier than adding support for things in the Observium codebase itself, but is not recommended for things which are relatively simple to add support for, like Sensors, CPU and Memory statistics.
This feature is particularly useful for uncommon metrics, like wireless radio statistics or statistics from unusual appliances.
Subscription Feature
This is a feature which is currently only included in the Subscription Edition of Observium.
Adding a Custom OID
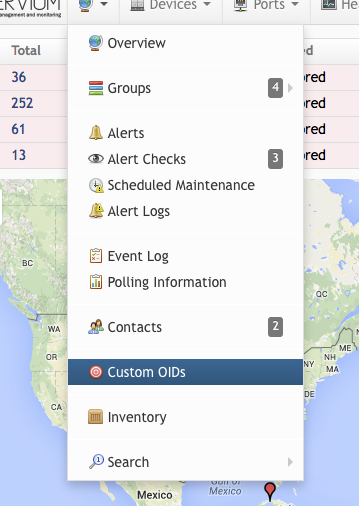
Click on the “Custom OID” menu in the global menu (the one with the globe), and you’ll arrive at an overview of the custom OIDs configured by on your Observium.
Then click on the “Add Custom OID” option in the right top corner to get the input fields:
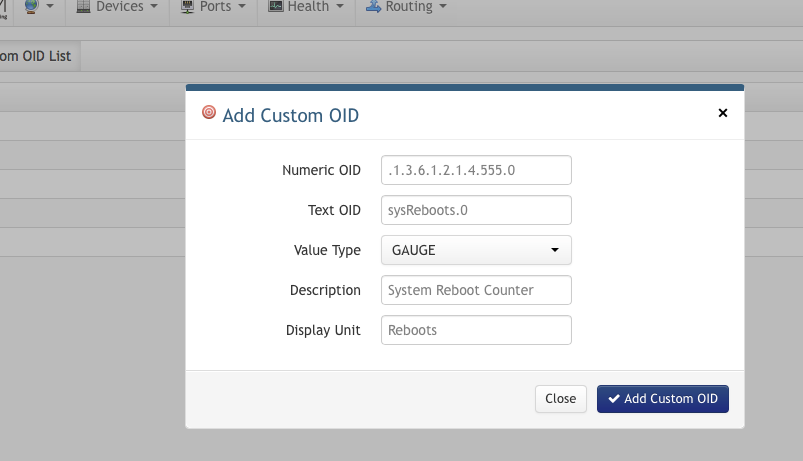
There are a number of fields to be filled in:
| Field | Description |
|---|---|
Numeric OID |
This is the OID in SNMP that you want to monitor |
Text OID |
This is used as the 'pretty' identifier for the oid, it’s advisable to use the MIB textual oid name for this |
Value type |
Specific wether the value you are retrieving is a GAUGE or a COUNTER (for information on what this is, i advise you to read the RRD documentation on the differences between the two. |
Description |
This is a description of the entry and is used in the overview |
Display Unit |
This is the text that will be displayed in the legend of graphs of the oid as the measured unit |
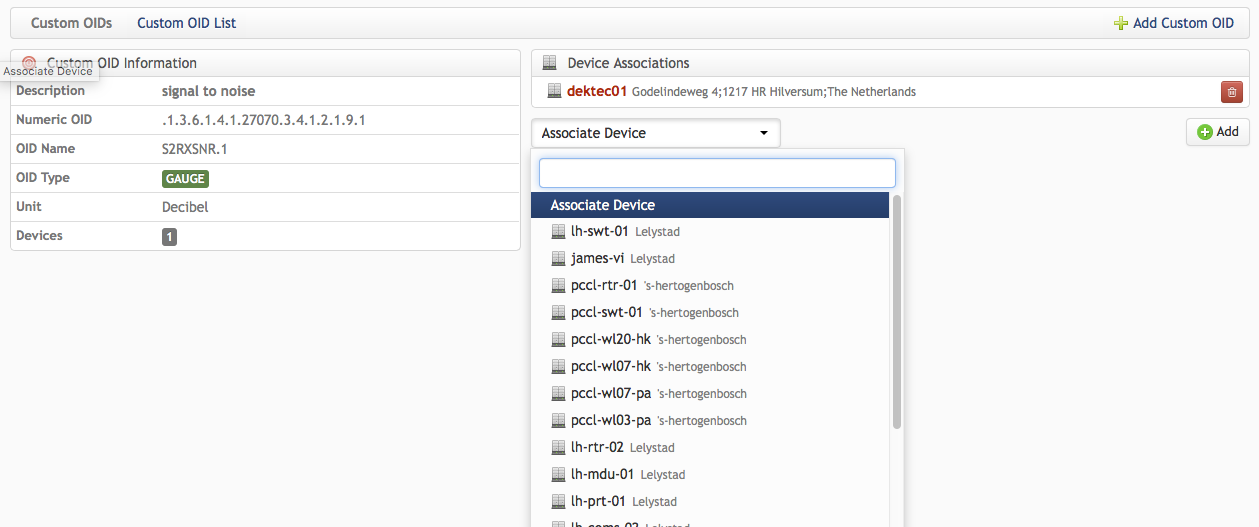
Once you’ve filled in the form, submit it, and you’ll be returned to the overview of custom OIDs.
Next you need to associate the custom OID with device(s). This association system is allows you to only write a custom OID once, and the associate with an unlimited amount of devices
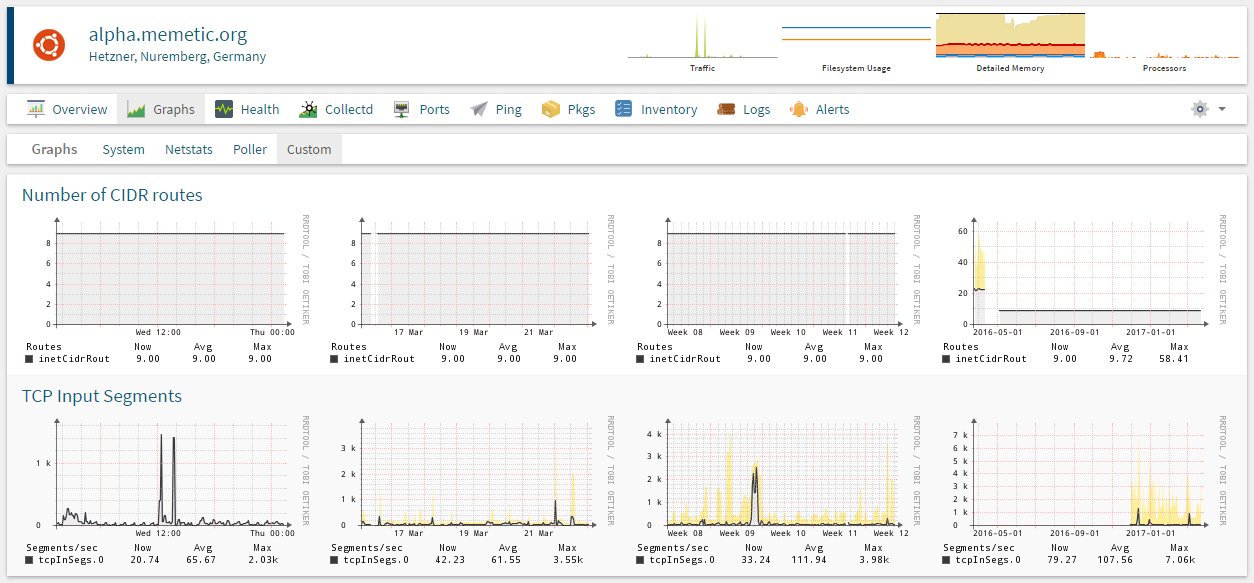
Once this is done, and you have the correct OID being polled, and after 15minutes of polling, you should be able to see graphs in the Custom Graphs part of the device:Once this is done, and you have the correct OID being polled, and after 15minutes of polling, you should be able to see graphs in the Custom tab of the device's graphs section:
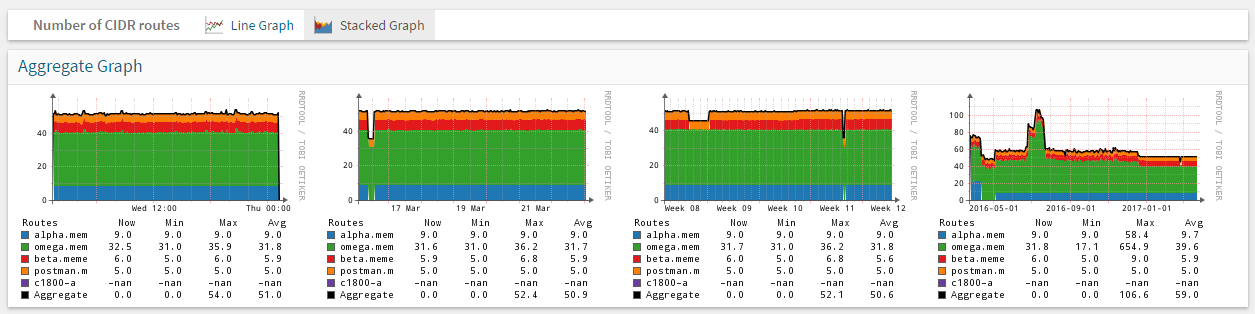
Aggregated graphs can also be seen in the Custom OID section itself.
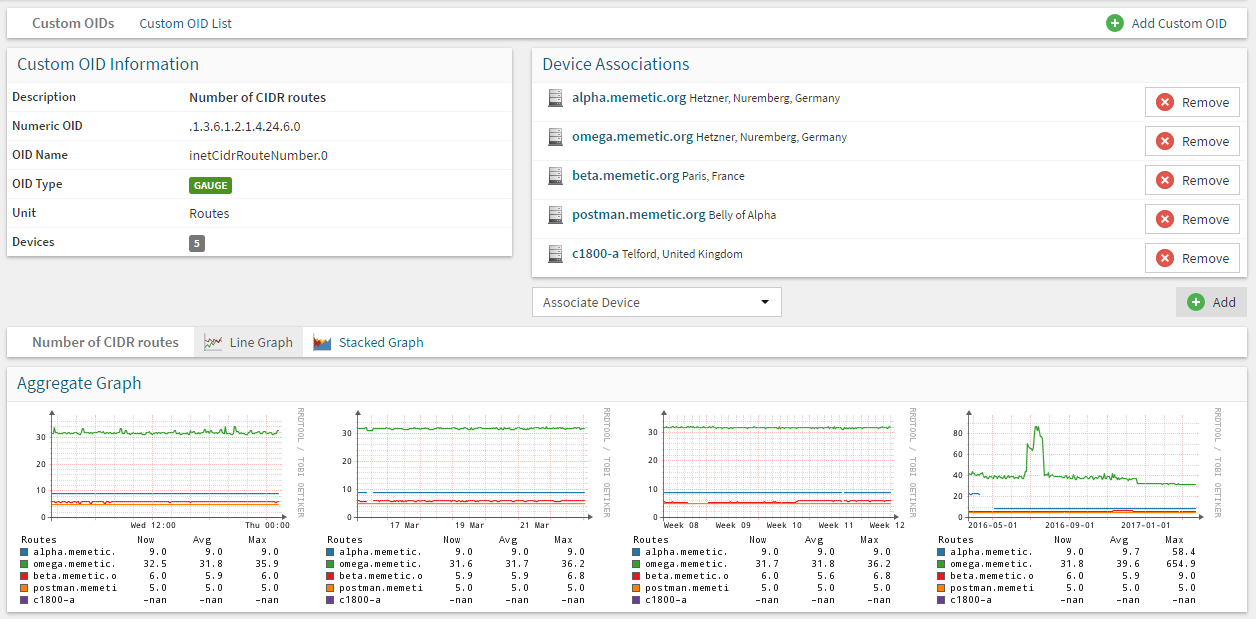
These graphs are also viewable as stacked graphs as well as simple line graphs for instances where that's useful.