Front Page
Removed
The legacy front page was removed in early 2019 and is not longer available in releases or revisions after this.
Global Configuration
The placement and order of modules on the front page is defined by a config.php variable. The default includes some useful modules :
| Text Only | |
|---|---|
Modules can be added or removed from this array in any order the user requires. Additional modules can be found below.
Modules
Map
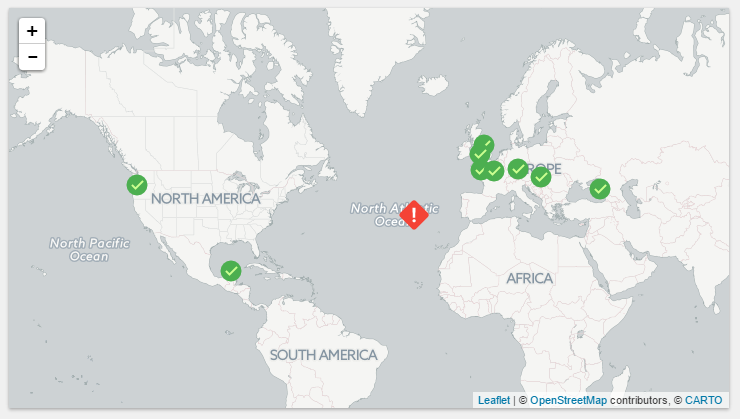
To enable the map ensure that map is resent in the frontpage order array as above.
The map displays "OK" and "Alert" markers for each location known to Observium. A number of configurable options are below :
| Text Only | |
|---|---|
Traffic Percentage Summary
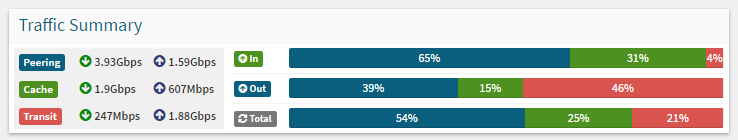
This module displays a summary of network egress traffic by type. It's primarily useful for service provider networks to quickly see the percentage of their traffic broken down by Transit, Peering and Cache.
To enable the module add portpercent to the frontpage order array as documented above.
The module uses the group system to define groups of ports to build the summary. You can see an example below:
| Text Only | |
|---|---|
The module can show a graphical representation of the traffic split in one of 4 formats configured using an options array. The graphs show the relative traffic quantities as a percentage.
| Text Only | |
|---|---|
Options are: single multi single_bare multi_bare and none.