UI Conventions
Observium uses a number of naming, colouring and other conventions to help make navigating the UI as intuitive as possible. Generally Observium will use the same colour and the same terminology for similar kinds of events, statuses and severities.
Colour Indicators
Tables will usually have a solid coloured state marker on the left of each row indicating the state of the entity or entry represented by the row and may have a subtle row background shade if the state is something other than OK or DISABLED.
Generally in Observium blue means up or ok and red means down or failed/alerted. Green and Purple usually mean the same for ignored entities, but can have other meanings, for example in the Alerting system where purple means an alert is administratively suppressed. Grey usually indicates that something has been disabled. Orange indicates that something is in a warning state or that its alert is being delayed. For ports orange also indicates that a port is down because a lower layer is down.
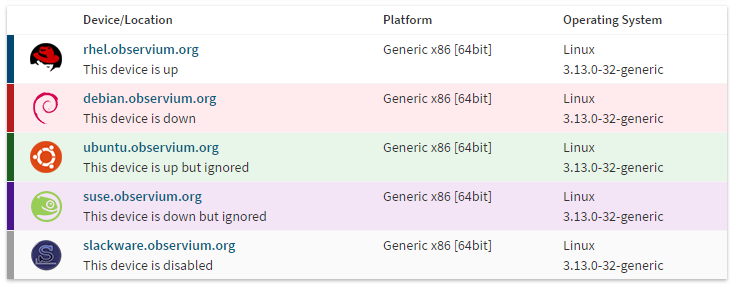
Device table colours
Devices have two states, UP and DOWN, and can be IGNORED or DISABLED in their settings. If a device is DISABLED, its state isn't indicated. If a device is IGNORED it can have one of two different colours depending upon its state.
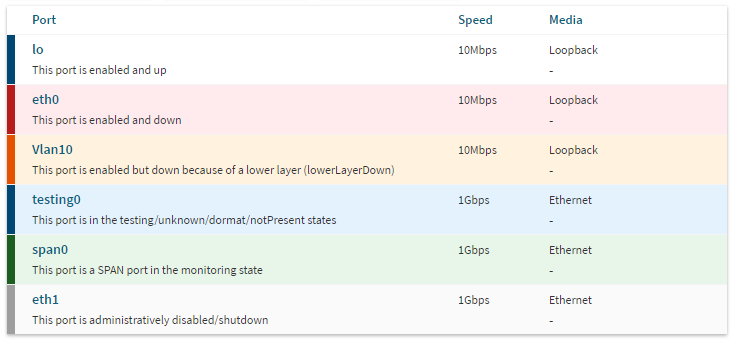
Port table colours
Ports have multple states which are a combination of the administrative and operational states of the interface. As well as enabled/up, enabled/down and disabled, Observium also indicates a monitoring state for SPAN ports and a final state for ports in the testing/unknown/dormat/notPresent states.