Power Billing
Introduction
Subscription Feature
This is a feature which is currently only included in the Subscription Edition of Observium.
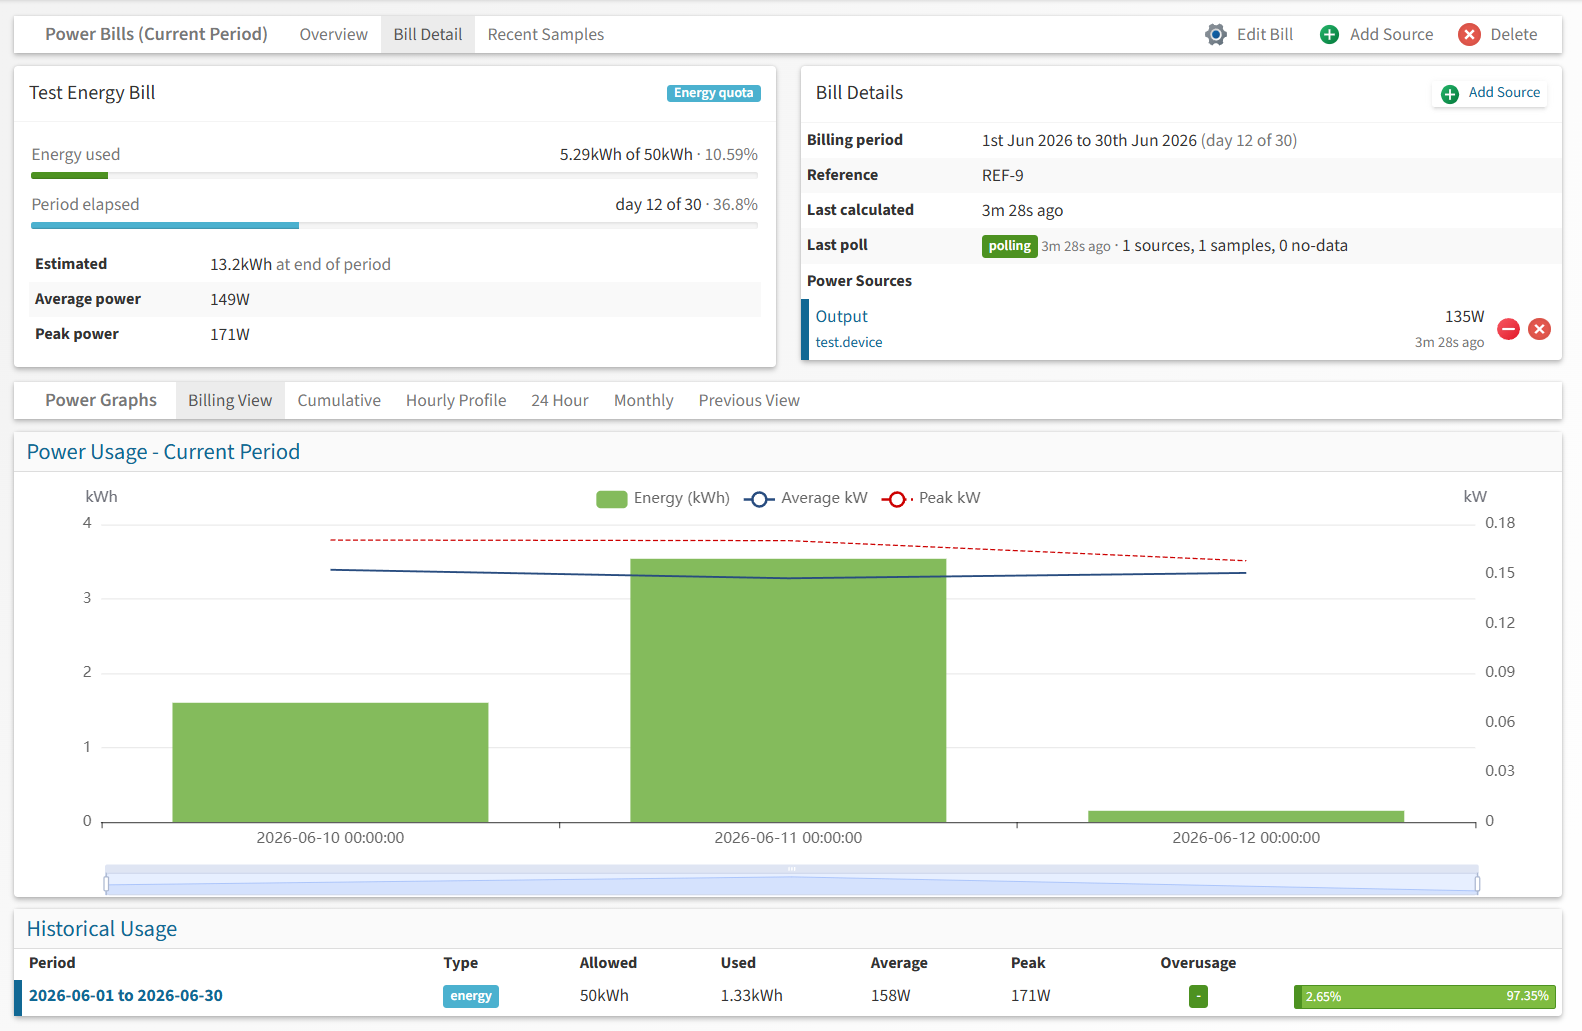
The power billing module measures electrical energy consumption from your monitored power infrastructure (PDUs, UPSes, meters) and bills it against monthly allowances, in the same spirit as the traffic accounting module bills port traffic.
Each power bill aggregates one or more sources — energy counters or sensors discovered on your devices — and is sampled every five minutes. Usage is calculated against the bill's allowance for each billing period, closed periods are kept as history, and the web interface provides usage projections, burn-up charts and per-source health.
Bill Types
- Energy quota — bills total energy used per period (kWh) against a kWh allowance, like a transfer quota.
- Demand — bills the peak power drawn during the period (kW) against a kW allowance, similar in spirit to utility demand tariffs.
Note
The recorded peak is the highest five-minute sample. Utility demand metering commonly uses 15 or 30 minute windows, so Observium's peak will read slightly hotter than a utility meter for bursty loads.
Power Sources
A bill can draw from three source types, reflecting what real hardware exposes. They form an accuracy hierarchy, and every sample records which level it came from:
| Source type | What it reads | Accuracy |
|---|---|---|
| Energy counter (Wh) | The device's own cumulative energy meter (counter class energy) |
measured — the device integrates, nothing between polls is missed |
| Power sensor (W) | An instantaneous power reading (sensor class power), integrated over each poll interval |
integrated — fluctuations between polls are averaged |
| V + A estimate | Voltage × current (× power factor when a sensor is mapped) | estimated — approximated real power |
V + A estimates
Without a power factor sensor, PF is assumed to be 1.0, which overestimates real power for reactive loads. The calculation is single-phase: add each phase of a three-phase feed as its own source.
A bill mixing source types reports its accuracy as mixed.
Configuration
The database schema is installed automatically by the schema updater. No configuration option is required to enable the module — the Power Billing page appears in the Health menu for administrators, and for all users once bills exist.
Scheduling Pollers
Add the following lines to your crontab. The poller samples all sources every five minutes; the calculator closes billing periods into history once an hour.
| Text Only | |
|---|---|
1 2 | |
Change the user and path to match your installation.
Creating a Bill
Go to Health → Power Billing and use Add Bill in the navigation bar. Set the bill type, the billing day (the day of the month the period starts), and the kWh or kW allowance. Bills without an allowance still record usage, but show no progress or overage.
Adding Sources
On the bill page, use Add Source. Select the source type and device; the entity lists show each candidate's current reading (for example 53W now or 12.1kWh total) so you can verify you are picking the right feed before adding it. A source already attached to the bill cannot be added twice.
Sources can be temporarily disabled from the bill page without losing their configuration — disabled sources are skipped by the poller and marked accordingly.
Reliability
Power billing is defensive about unreliable devices:
- Sources whose underlying counter or sensor has not been refreshed within 15 minutes are skipped rather than sampled, and the energy is correctly accounted across the gap when the device returns.
- A counter that decreases (meter reset, device replacement, or a bogus reading over flaky SNMP) is never billed for the recovery jump — the sample is discarded and the baseline re-established on the next poll.
- Any sample implying more power than the configured ceiling is discarded as an anomaly:
Text Only 1 2
// Maximum believable power per source, in kW (default 1000)
$config['power_billing']['max_source_kw'] = 1000;
Graphs
The bill page provides several views of the collected data:
- Billing View / 24 Hour / Monthly / Previous — energy bars (kWh) with average and peak power lines, and the demand allowance marked on demand bills.
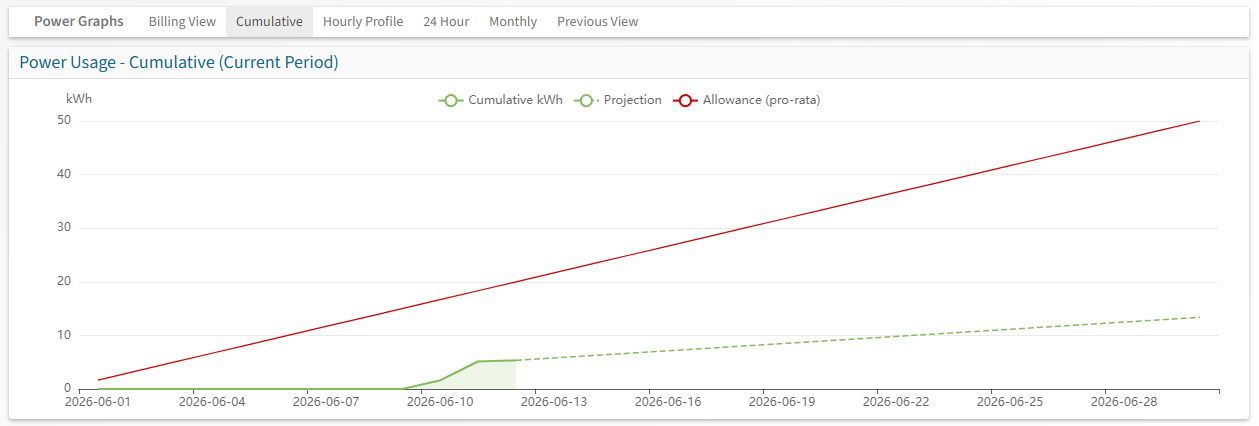
- Cumulative — a burn-up chart of energy used against the pro-rata allowance line, with a projection to the end of the period at the current rate.
- Hourly Profile — average consumption by hour of day across the period, showing when the load runs.
Rows in the Historical Usage table link to the graph for that closed period. The raw five-minute samples can be inspected via the Recent Samples toggle in the navigation bar.
Permissions
Power bills follow the same permission model as traffic bills: users of level 5 and above can view all bills, while individual bills can be granted to lower-level users or roles from the Edit User and Roles pages.